Overview Walkthrough
This page walks through the DevilTongues workflow inside the Shiny app: Market Data → Analysis → Execution Calculator → 3D Visualization. Each section below includes the corresponding UI screenshot.
Market Data
In the Market Data tab, users fetch the live spot price and scan the options chain using LSEG Refinitiv.
Select an underlying (e.g., MSFT.O) and click FETCH SPOT PRICE. The app displays the spot price and the timestamp at the moment the button is clicked.
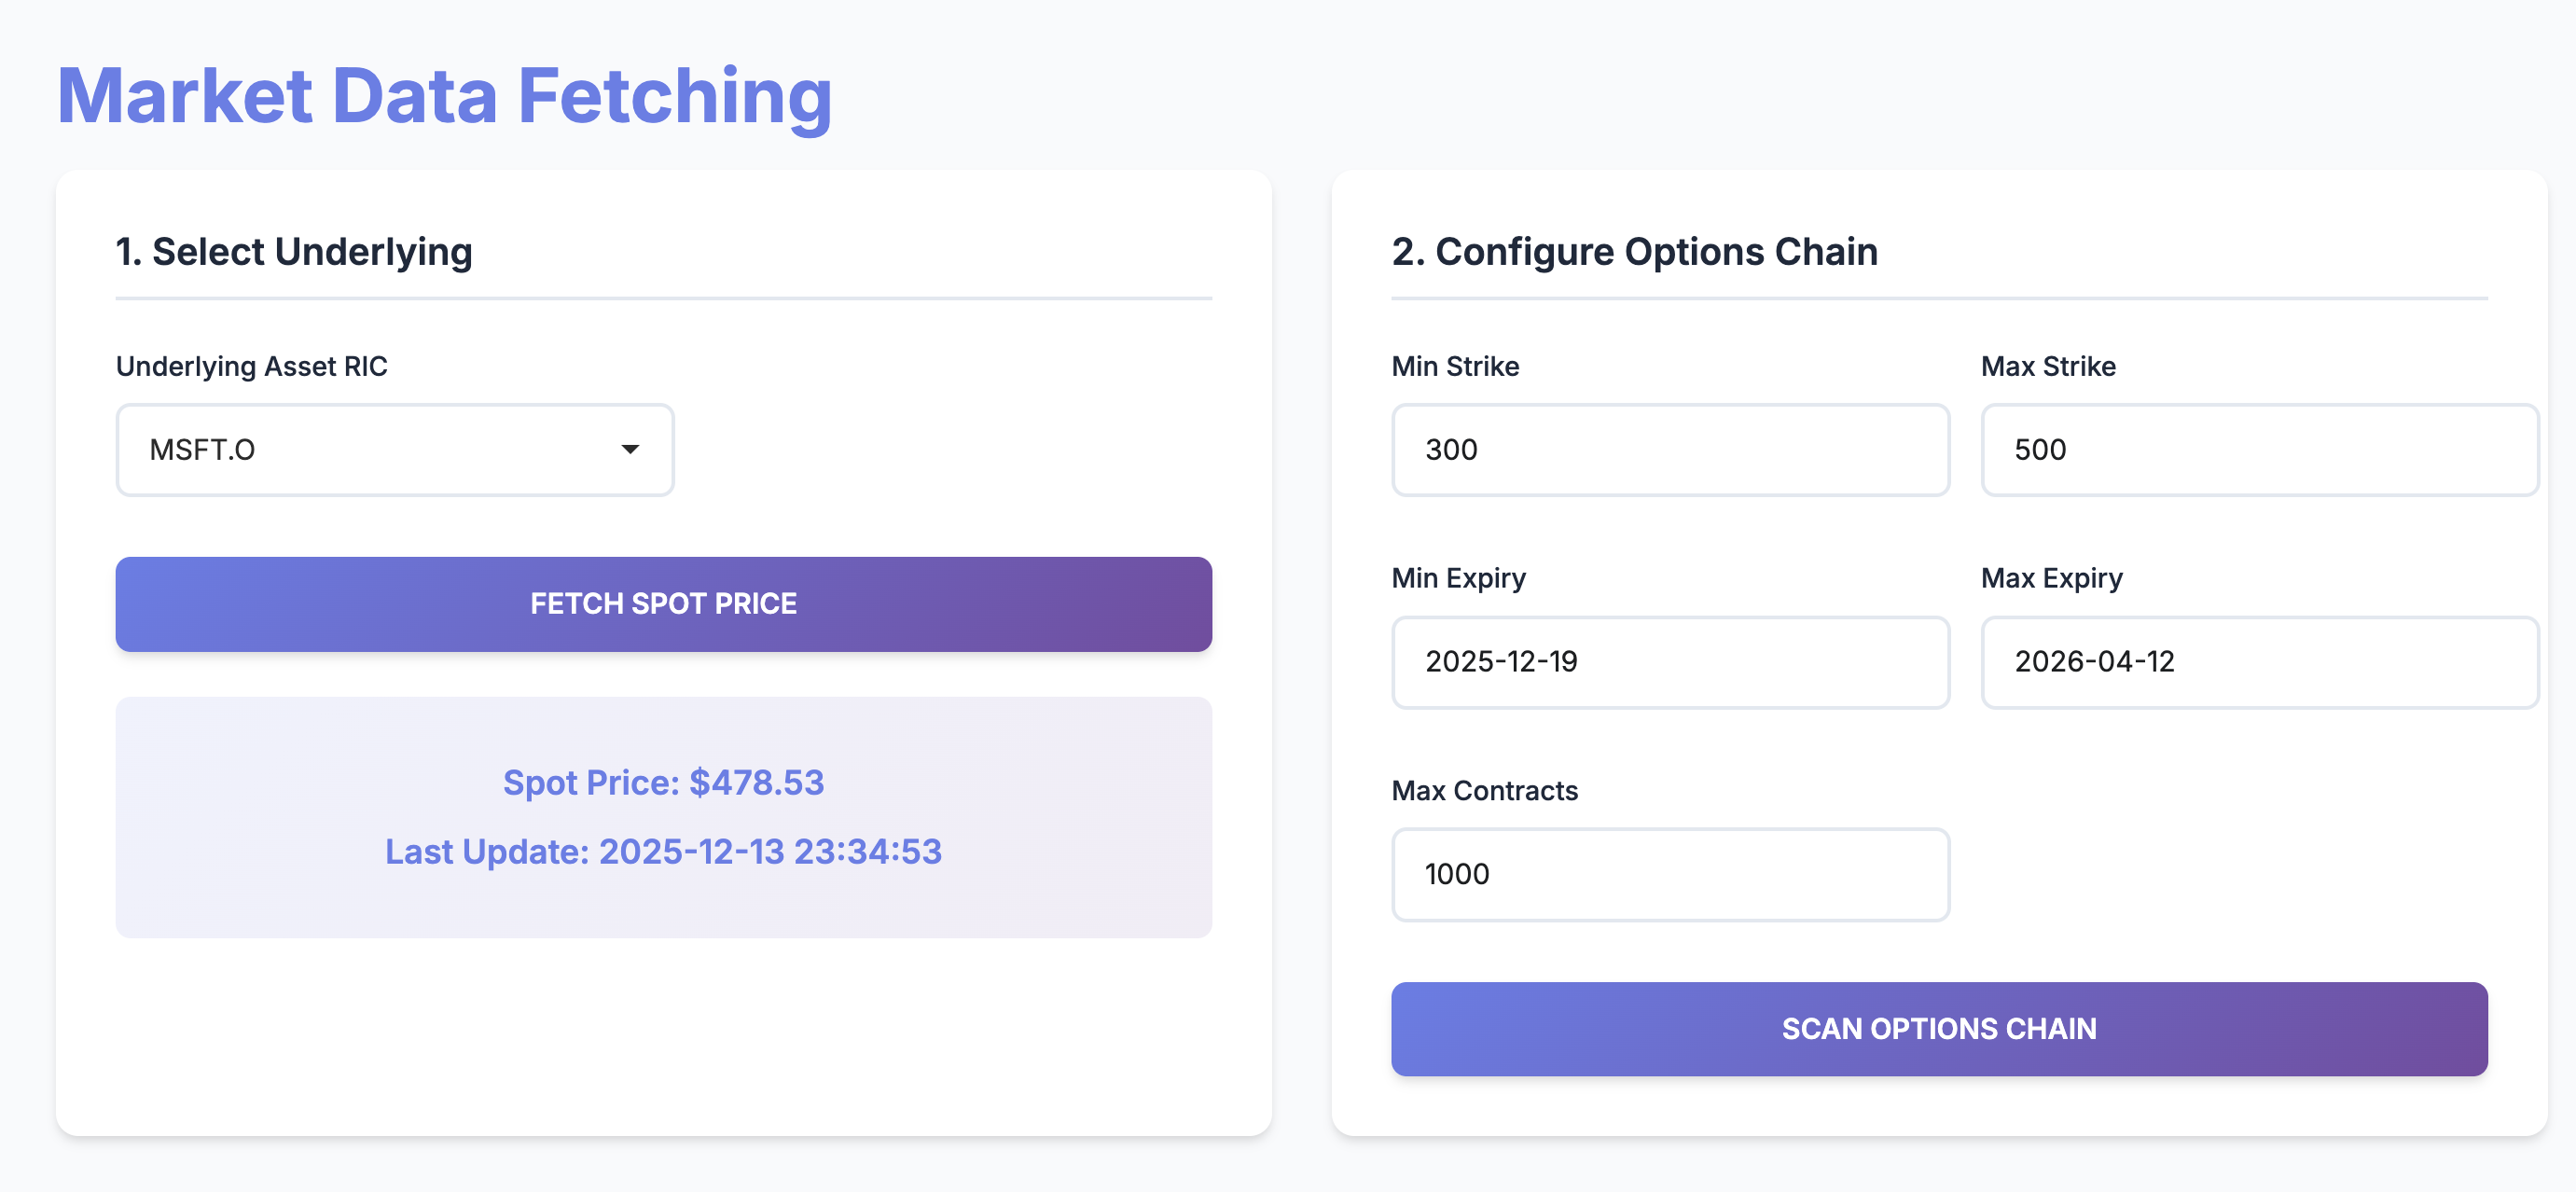
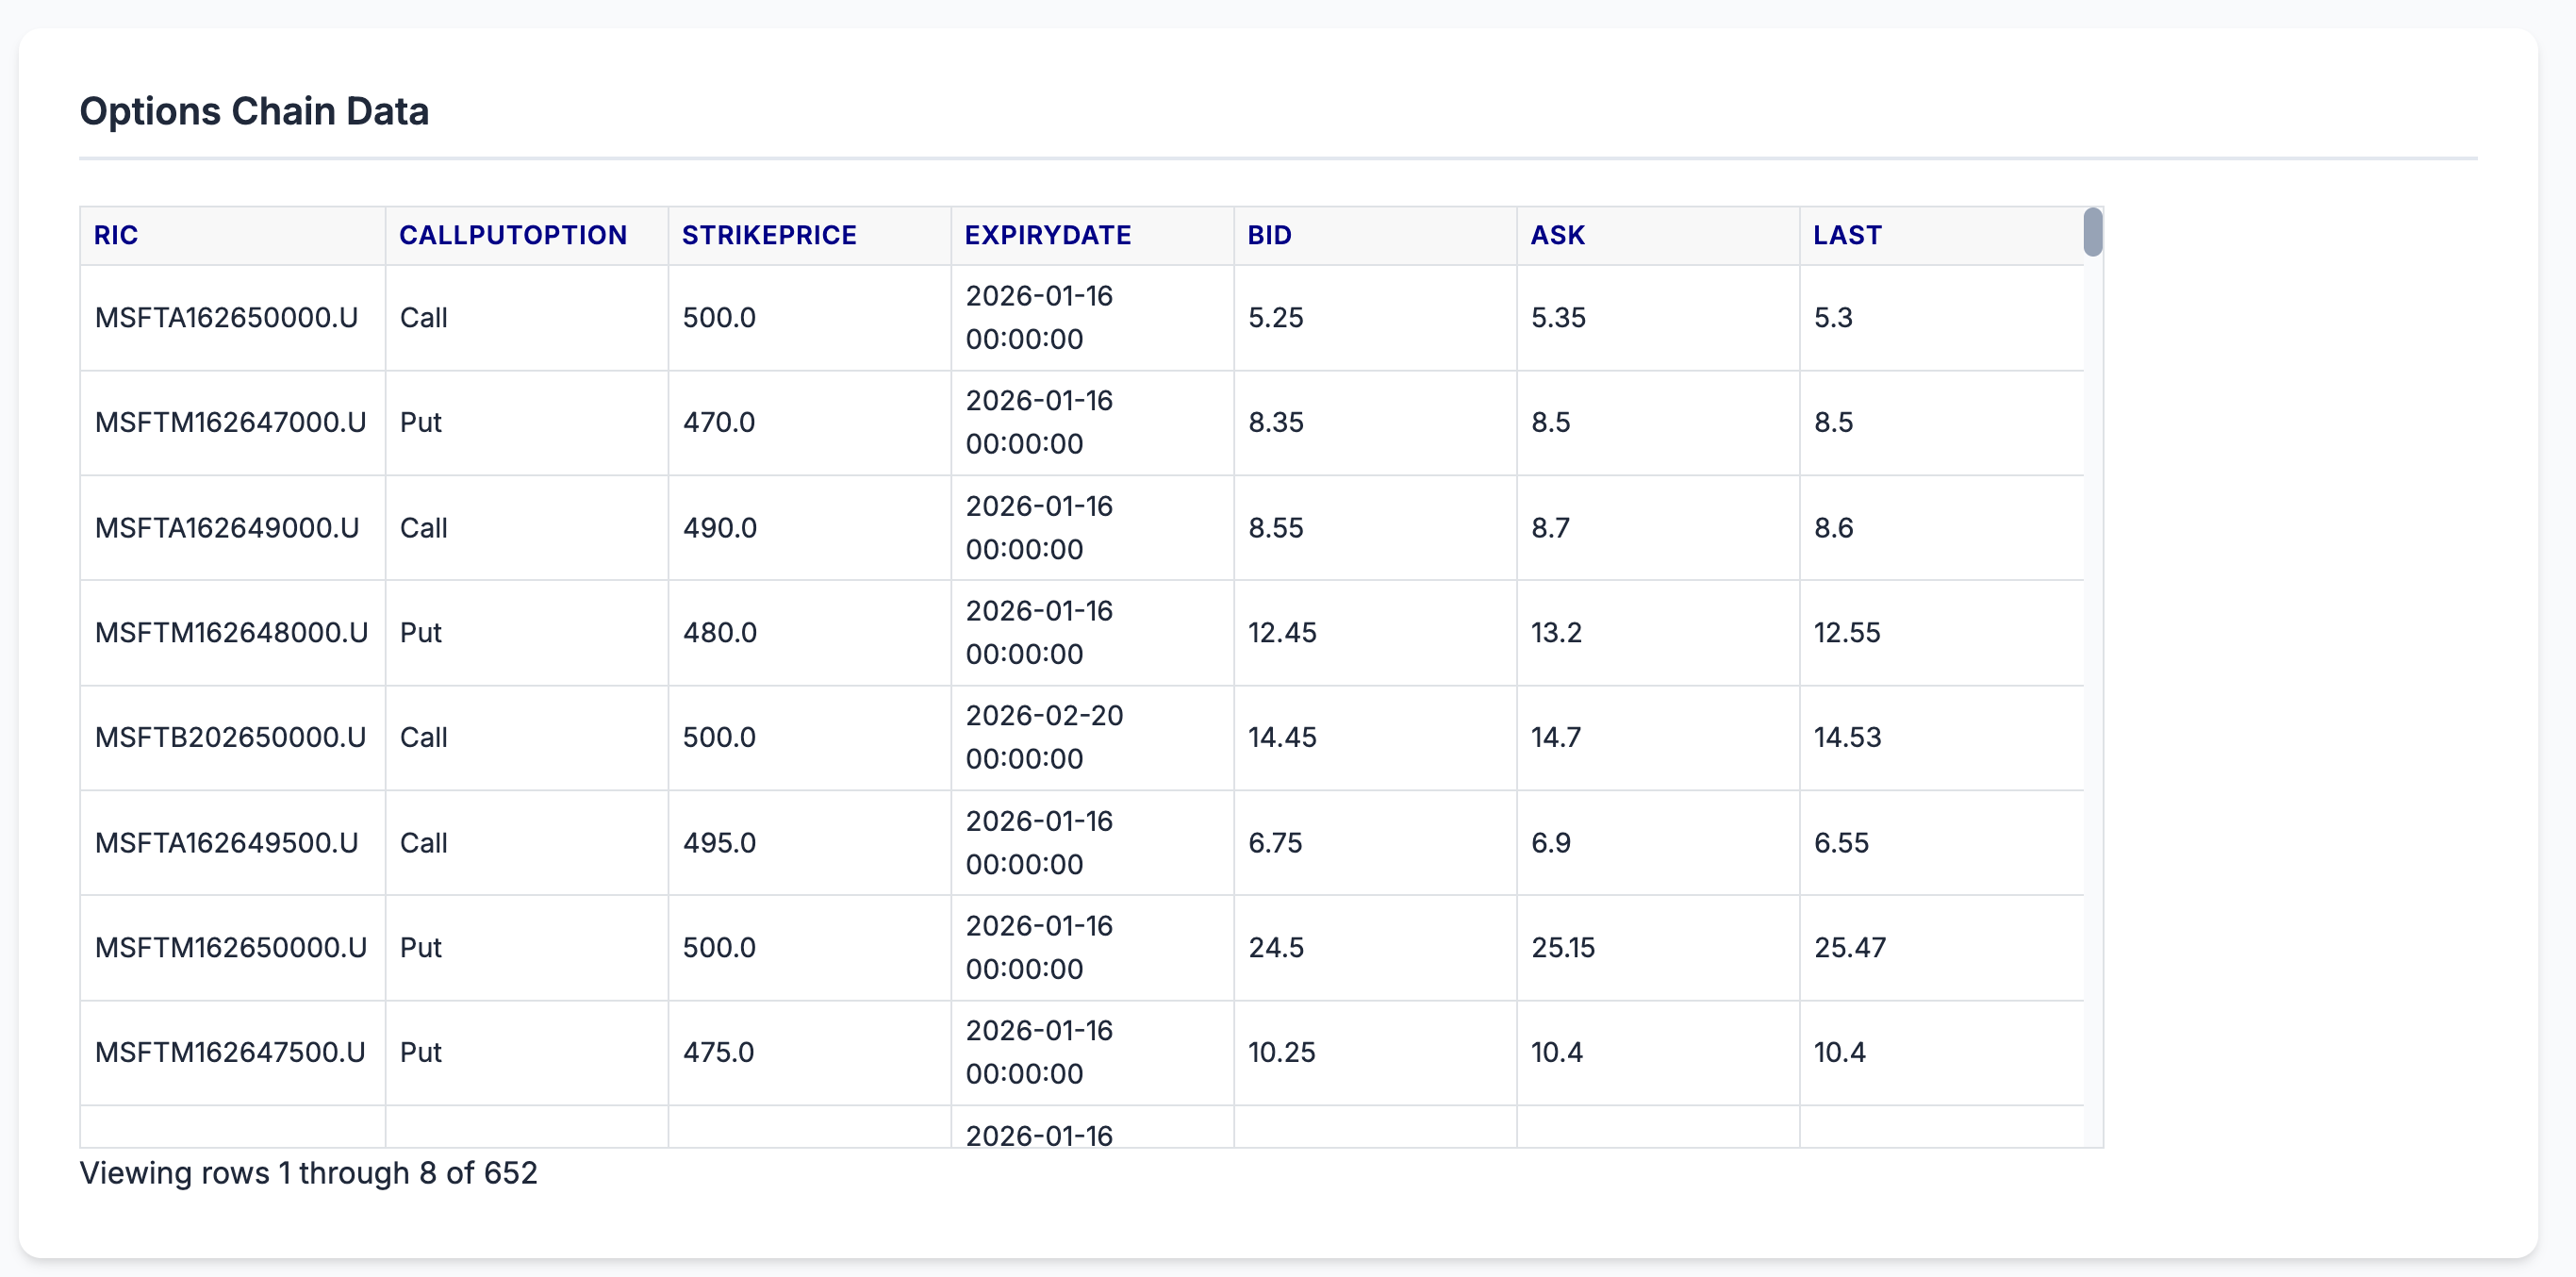
Configure strike bounds, expiry bounds, and max contracts, then click SCAN OPTIONS CHAIN. The app retrieves the options chain and displays the results in a table.
Analysis
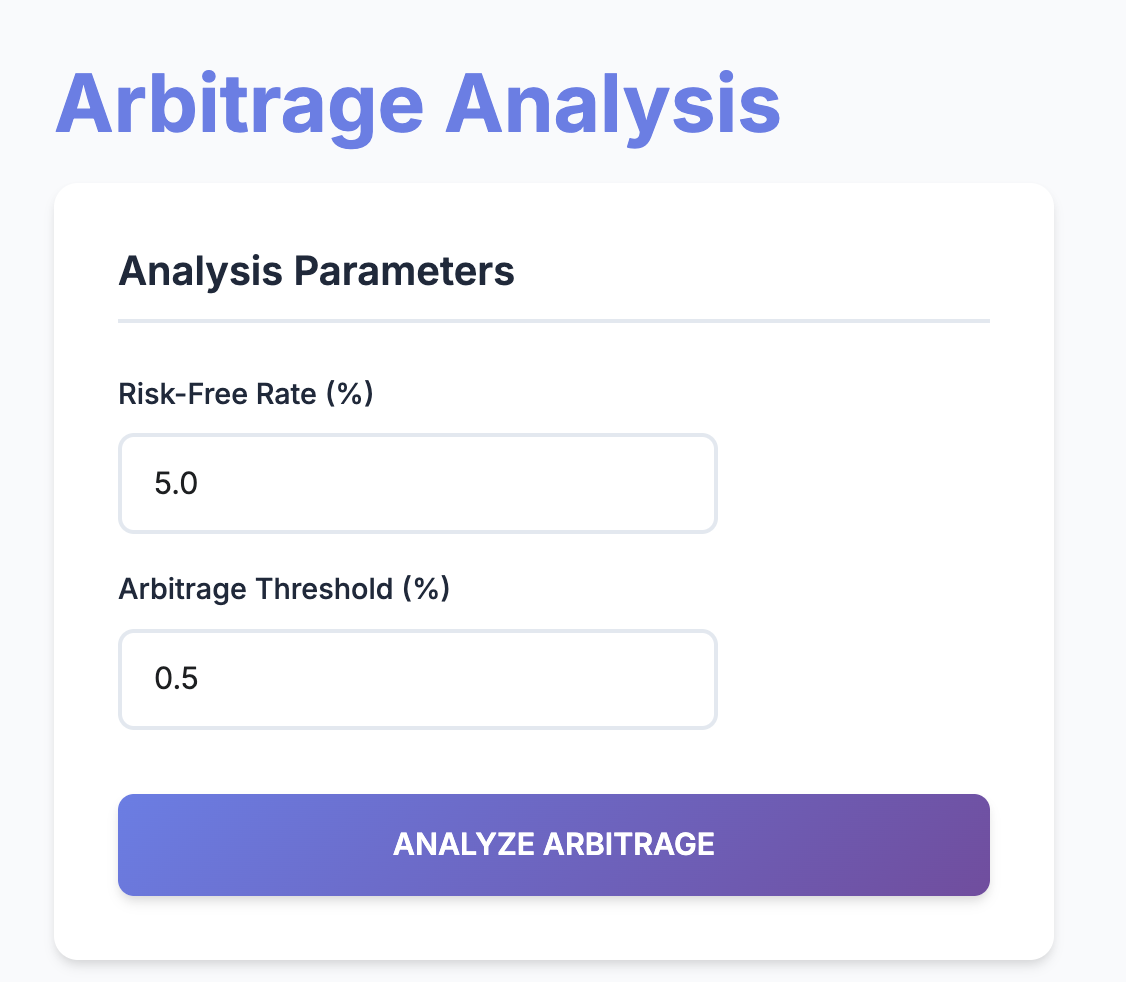
In the Analysis tab, the app computes implied risk-free rates via put-call parity and flags mispricings that exceed the threshold.
The Analysis page contains the navigator and analysis parameters. Users set the benchmark risk-free rate and the arbitrage threshold, then click ANALYZE ARBITRAGE.
After clicking ANALYZE ARBITRAGE, the app generates a table of detected opportunities, including strike, expiry, implied rate, and rate differential.
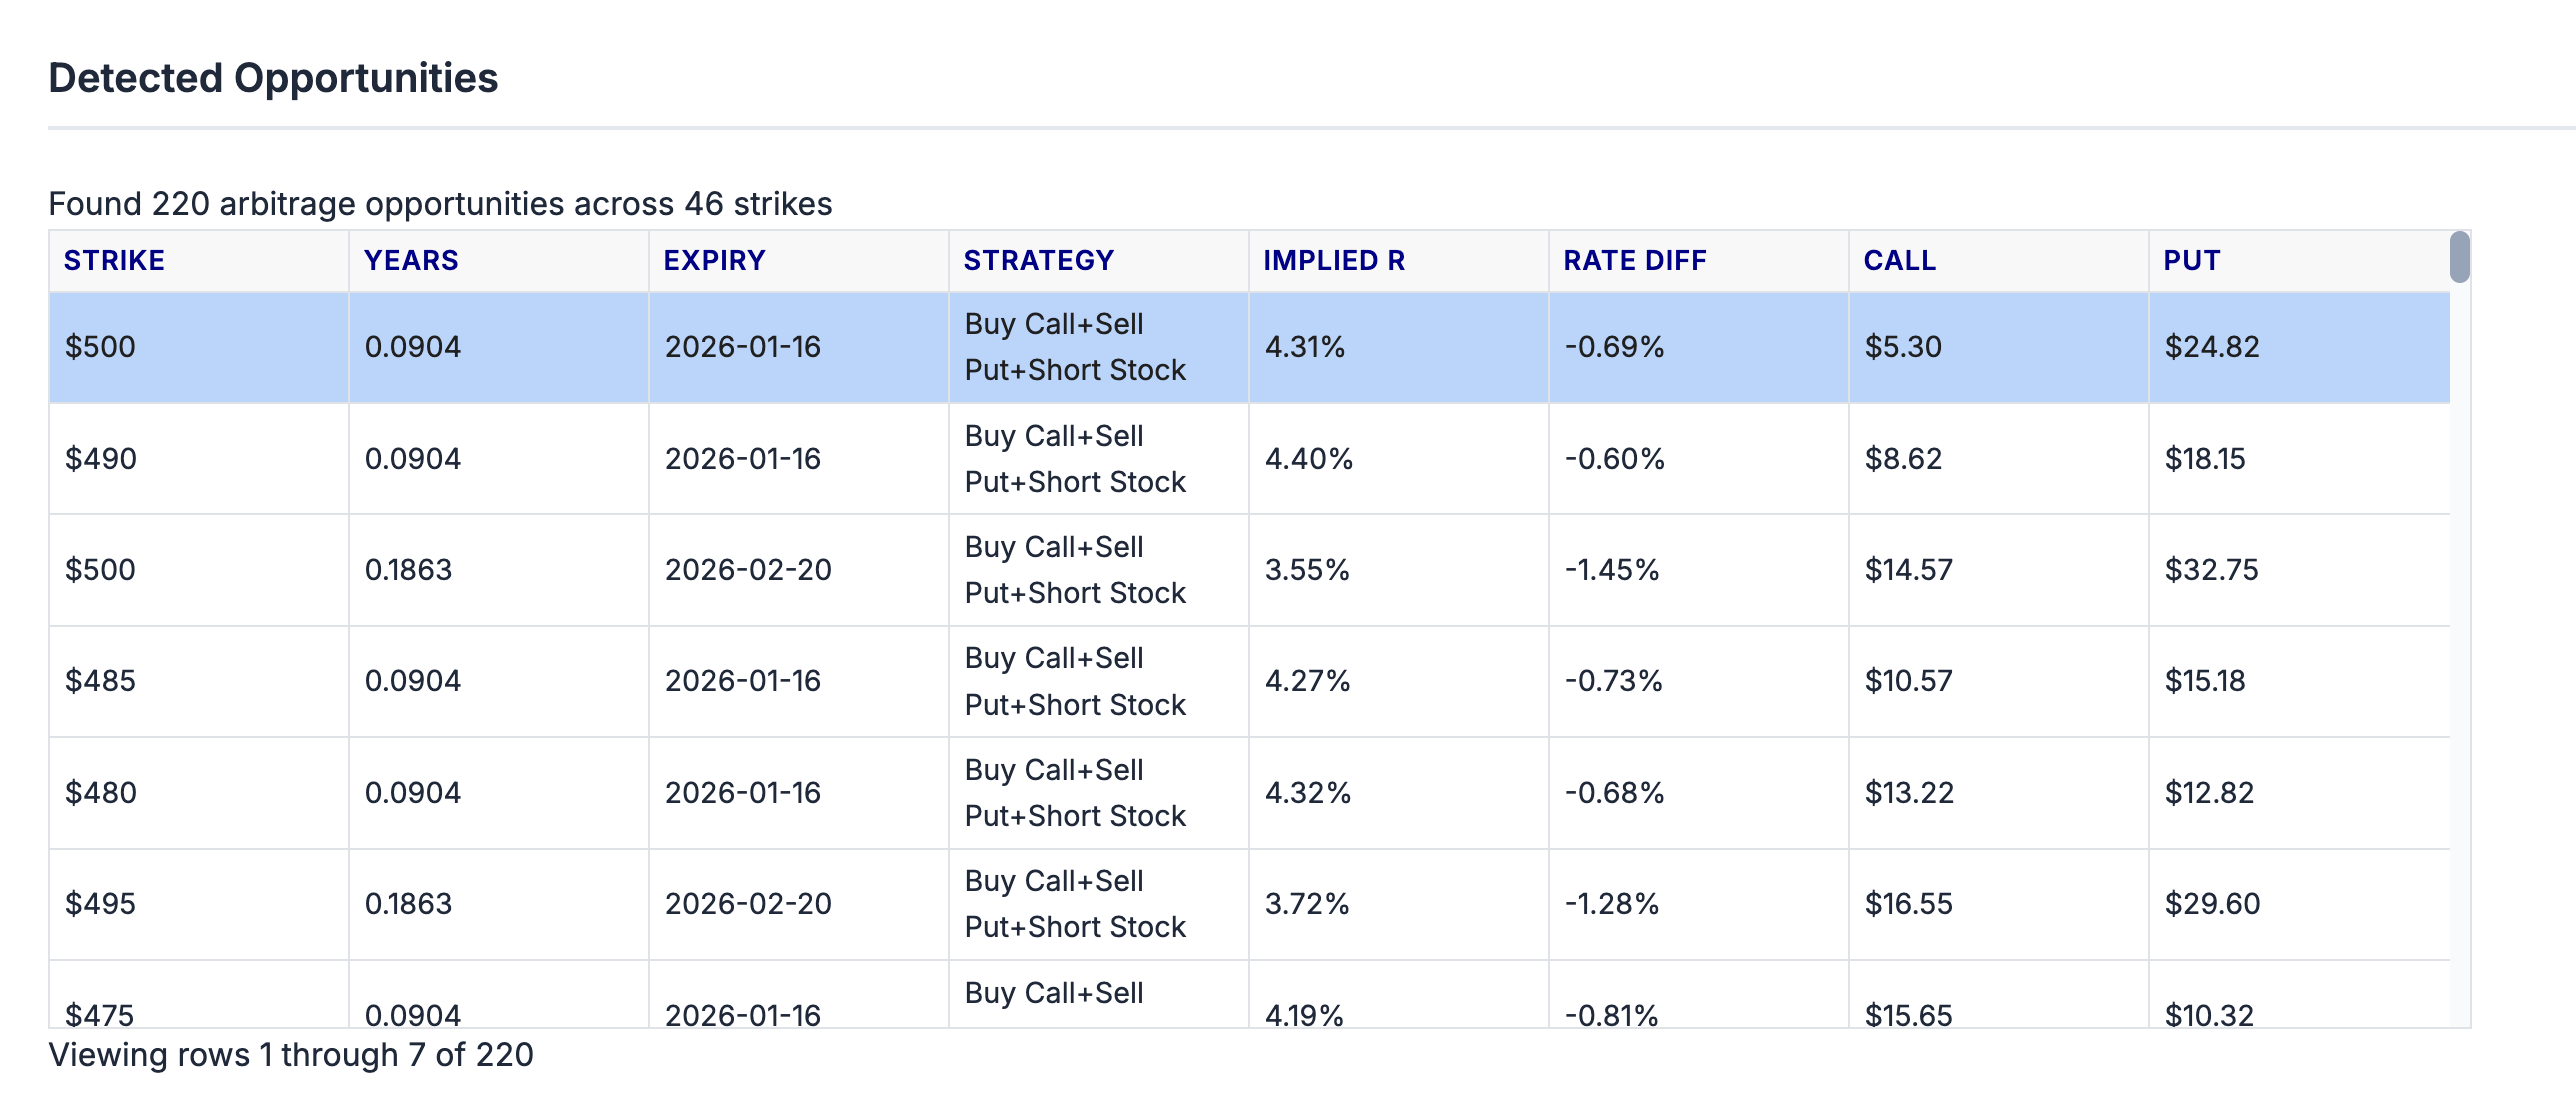
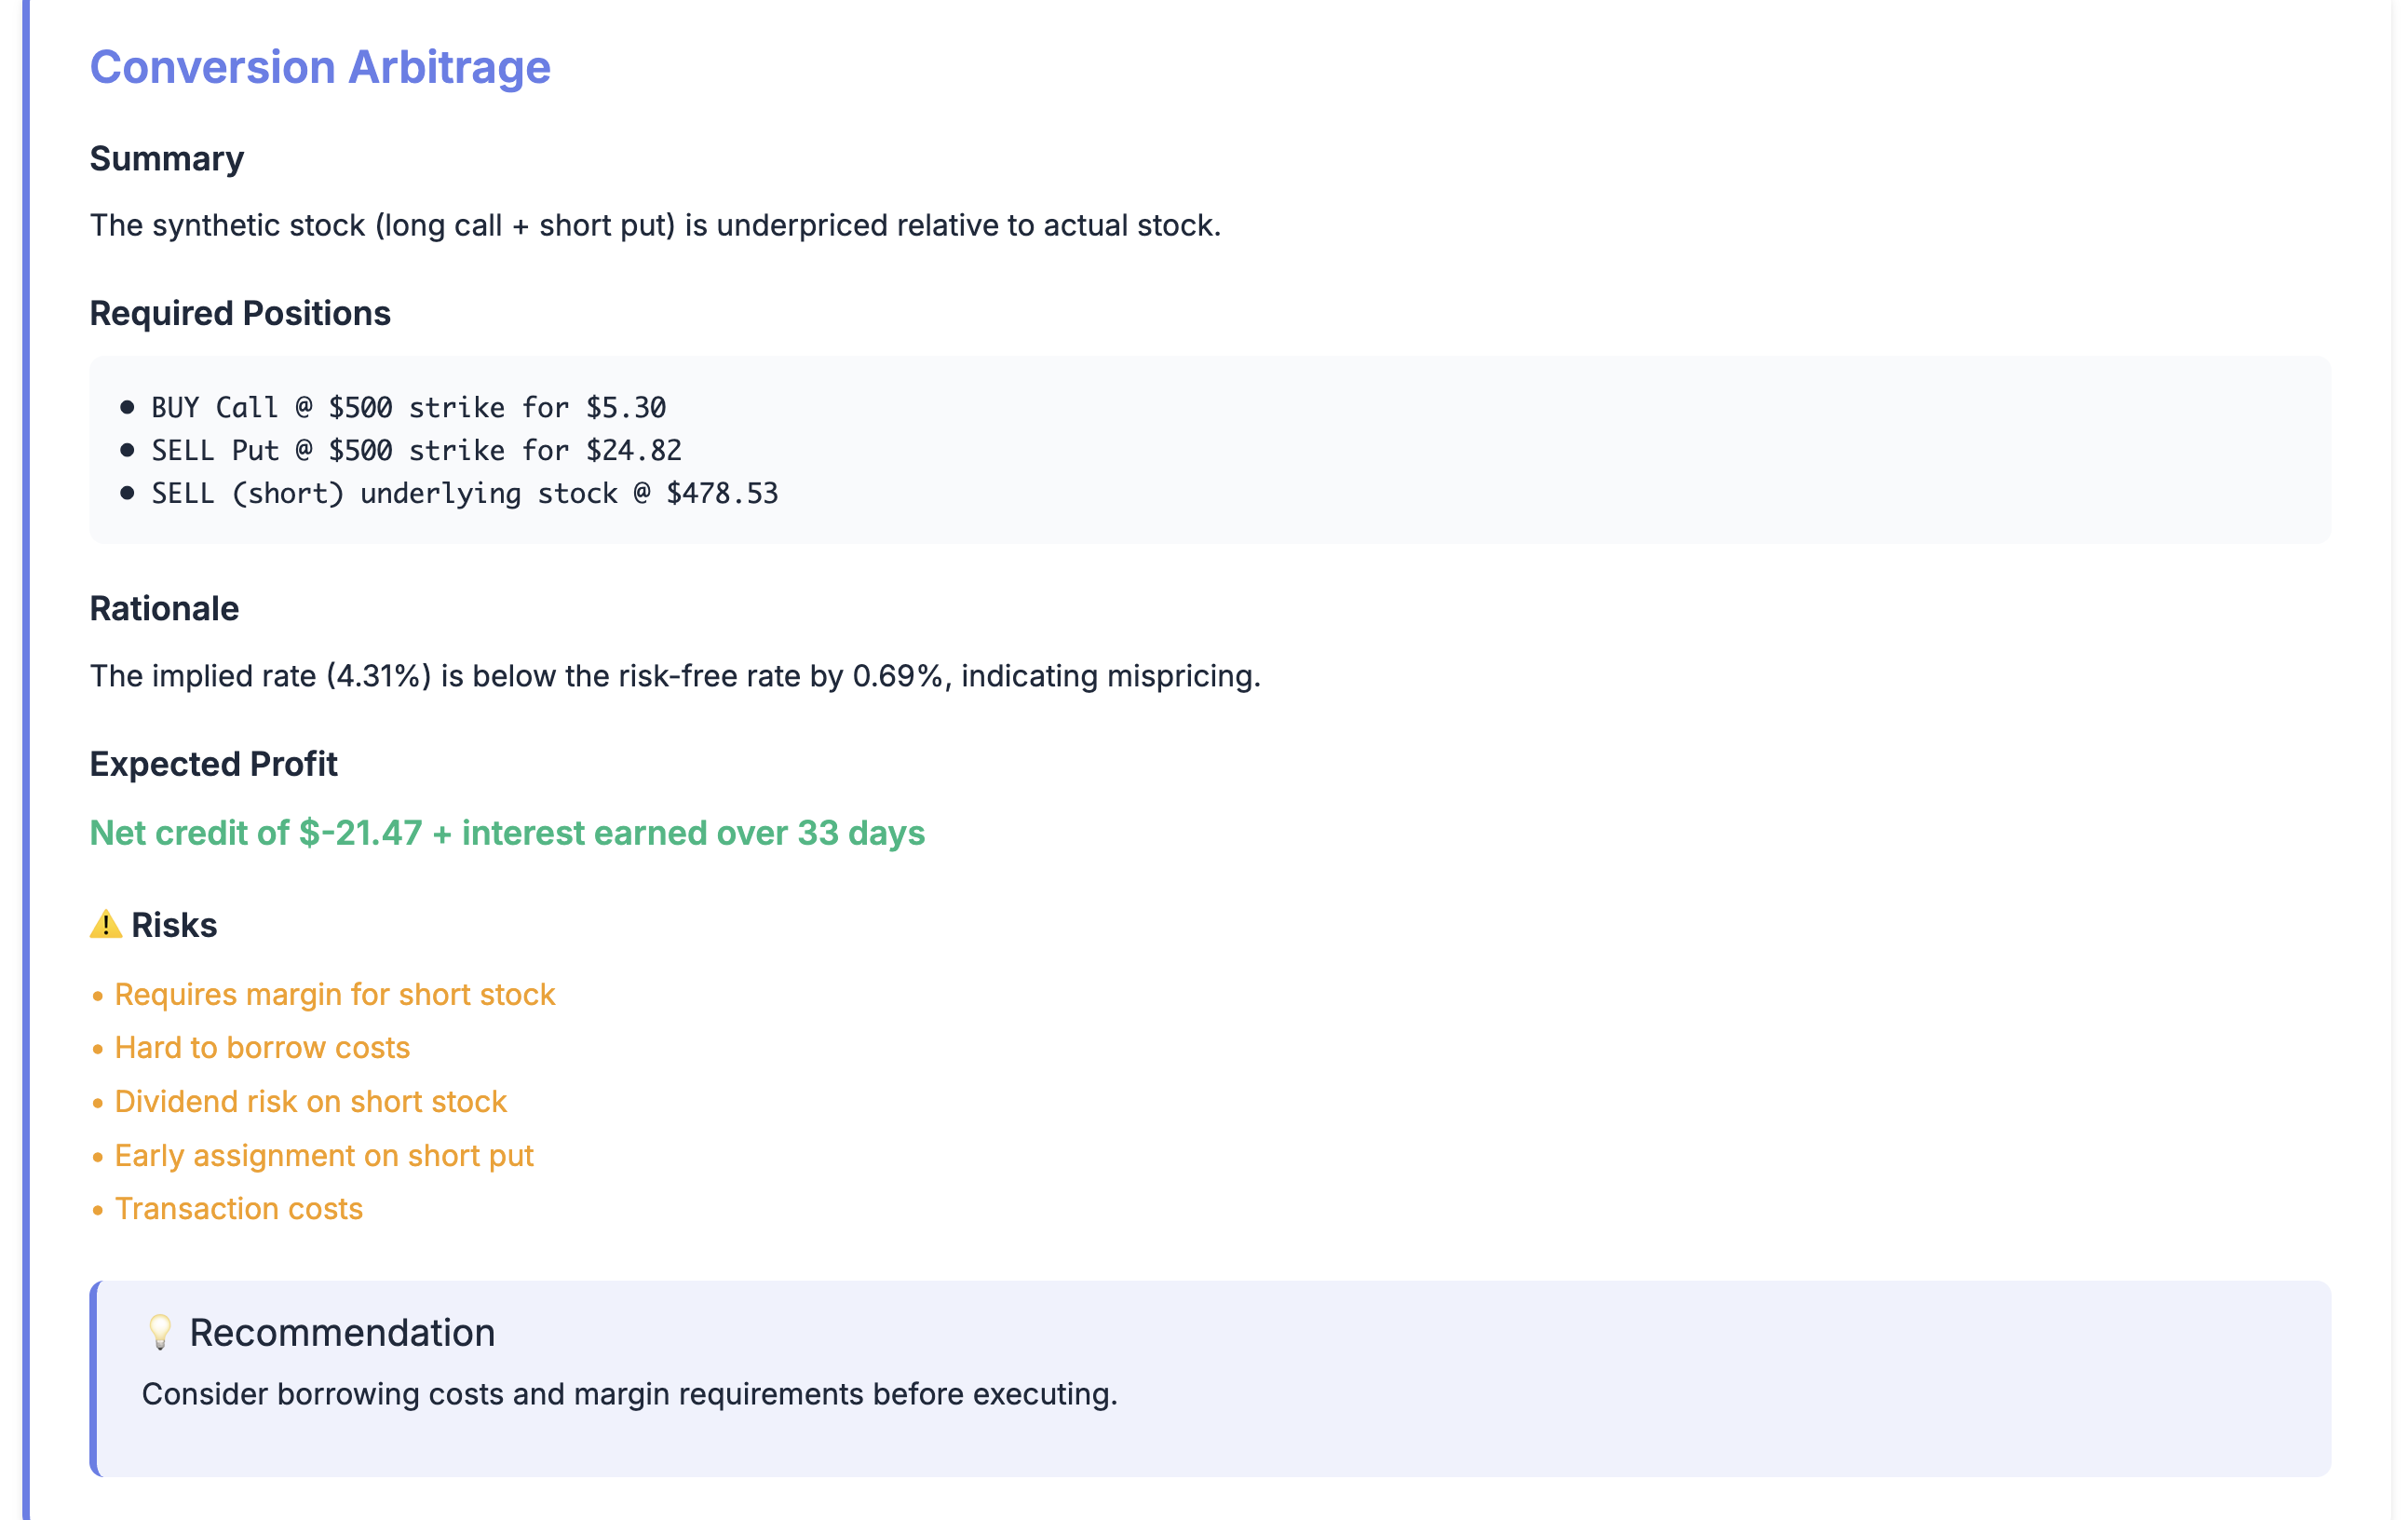
Selecting any row triggers a detailed breakdown: strategy type (conversion vs reverse conversion), required positions, rationale (implied vs benchmark rate), risk notes, and recommendations for execution.
Execution Calculator
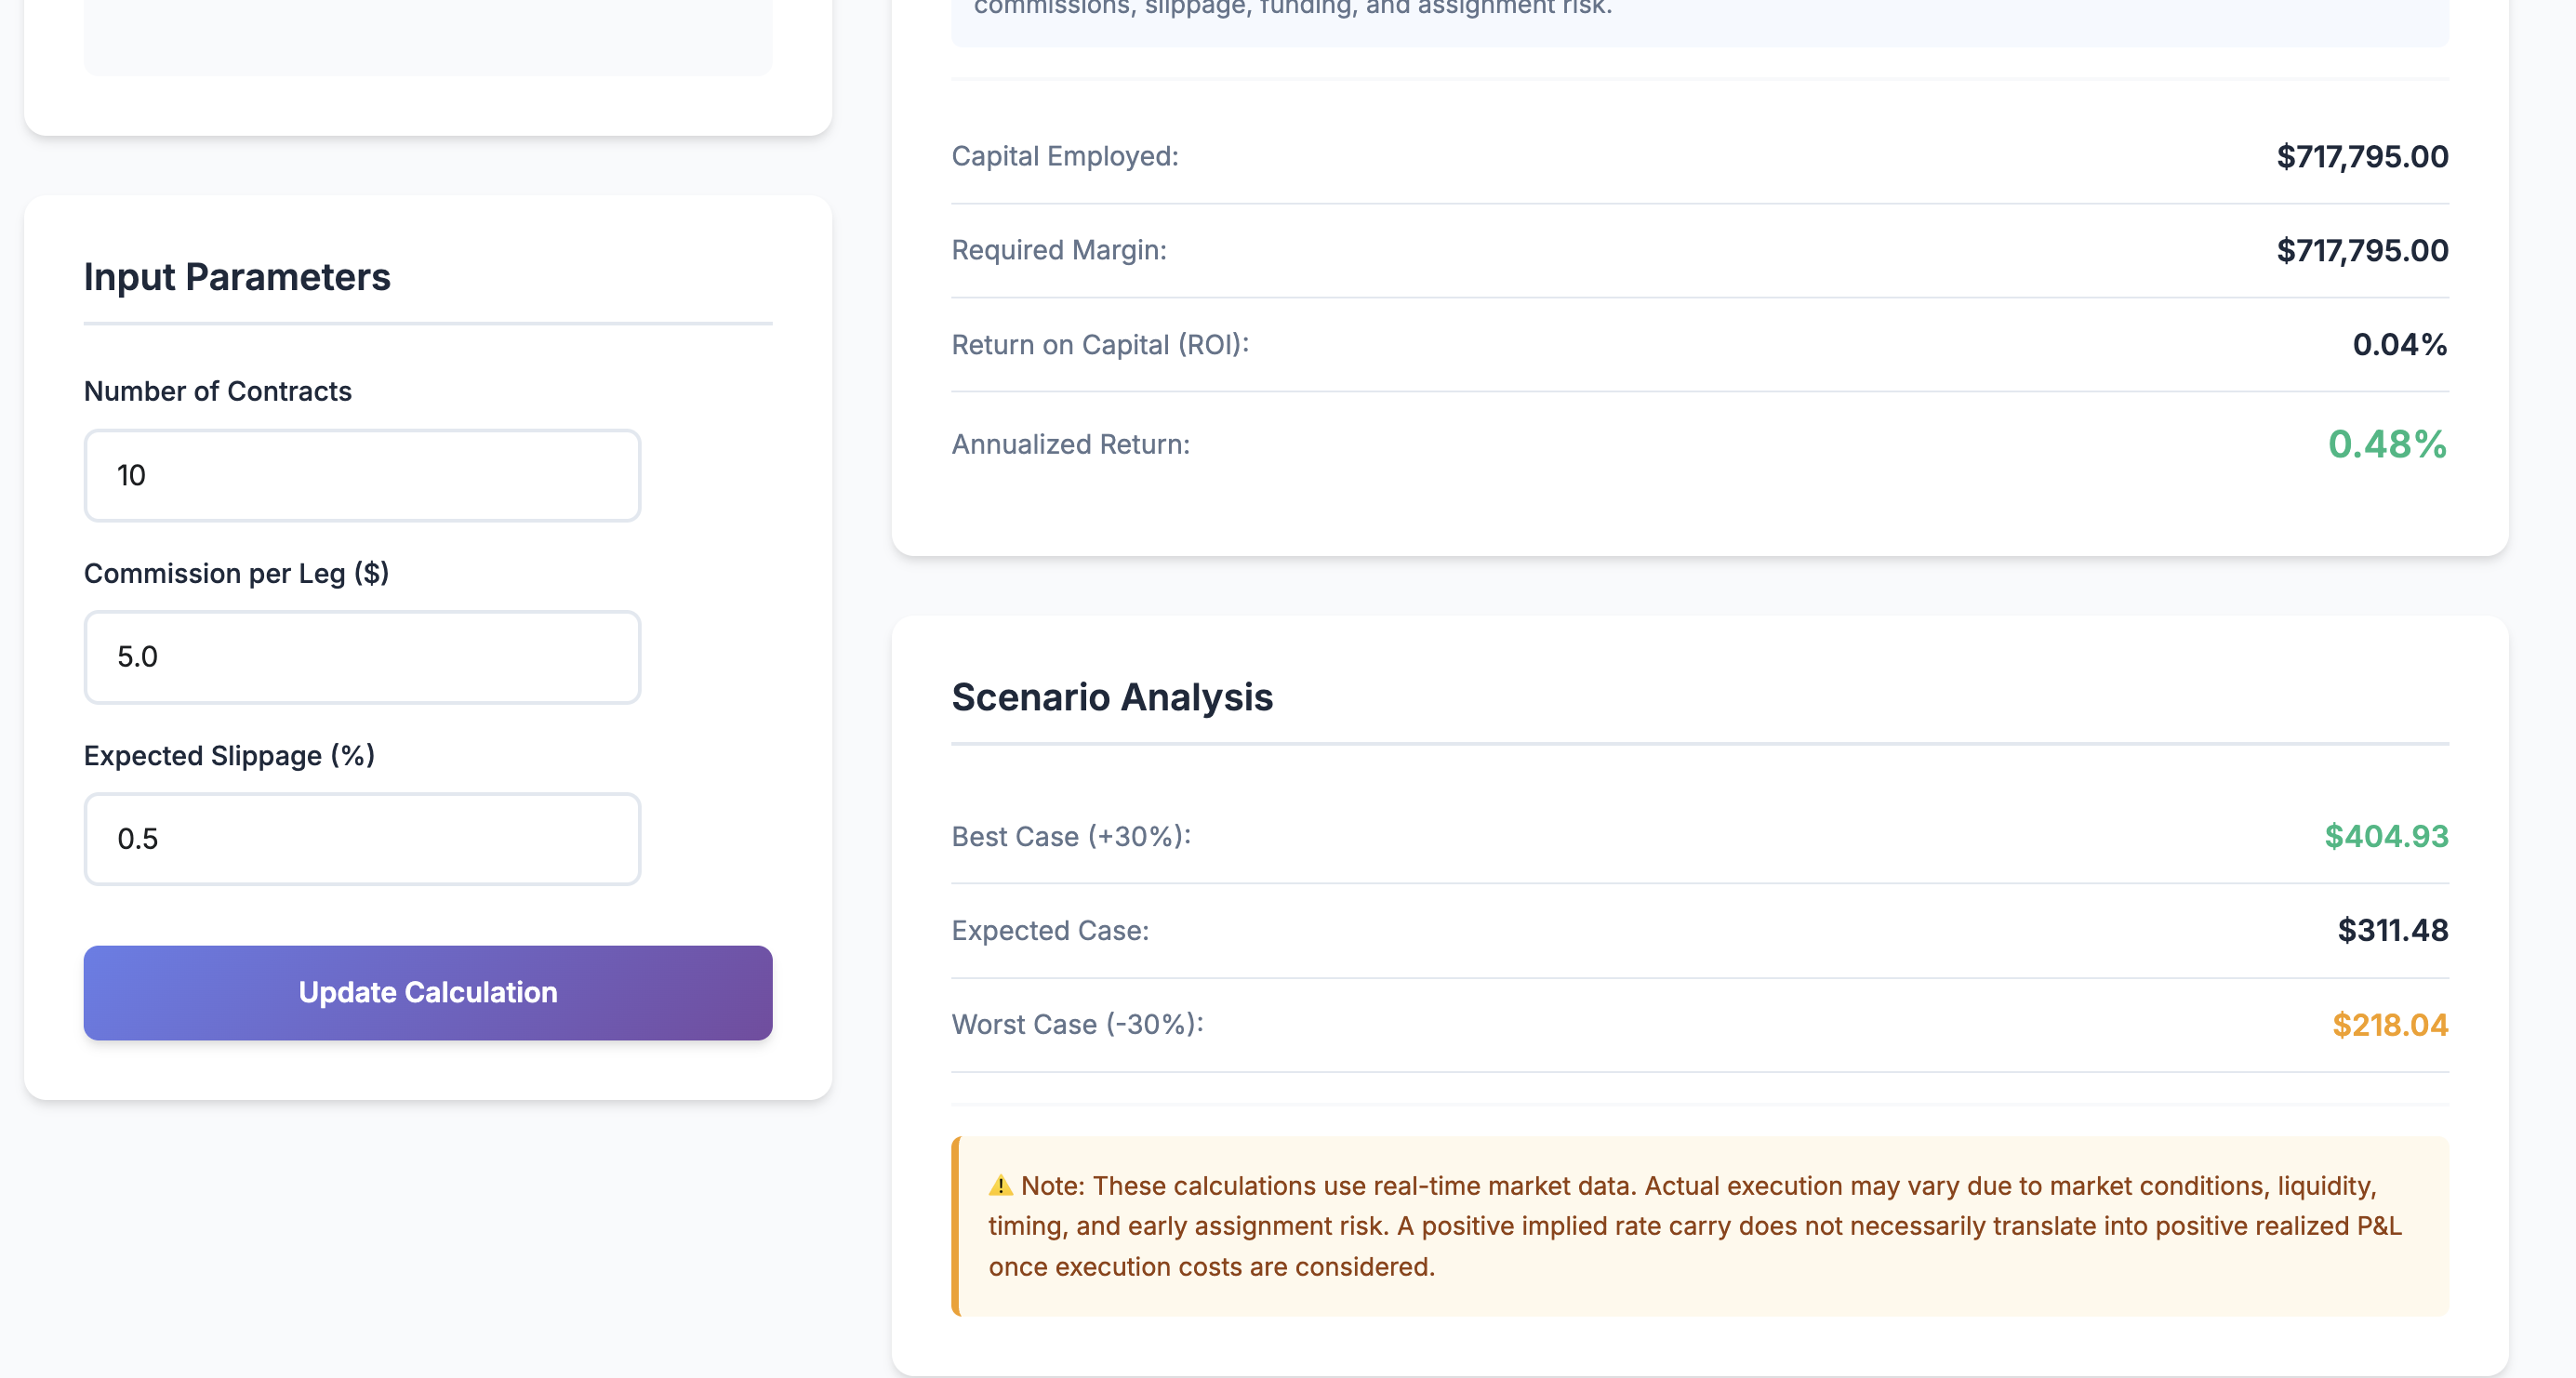
The selected strategy also feeds into the Execution Calculator, which models real-world costs and capital usage. Users can adjust contracts, commission per leg, and expected slippage.
Once a strategy is selected, the calculator loads the corresponding market inputs (strike, spot, option mid prices, days to expiry) and computes position values, costs, and expected returns.
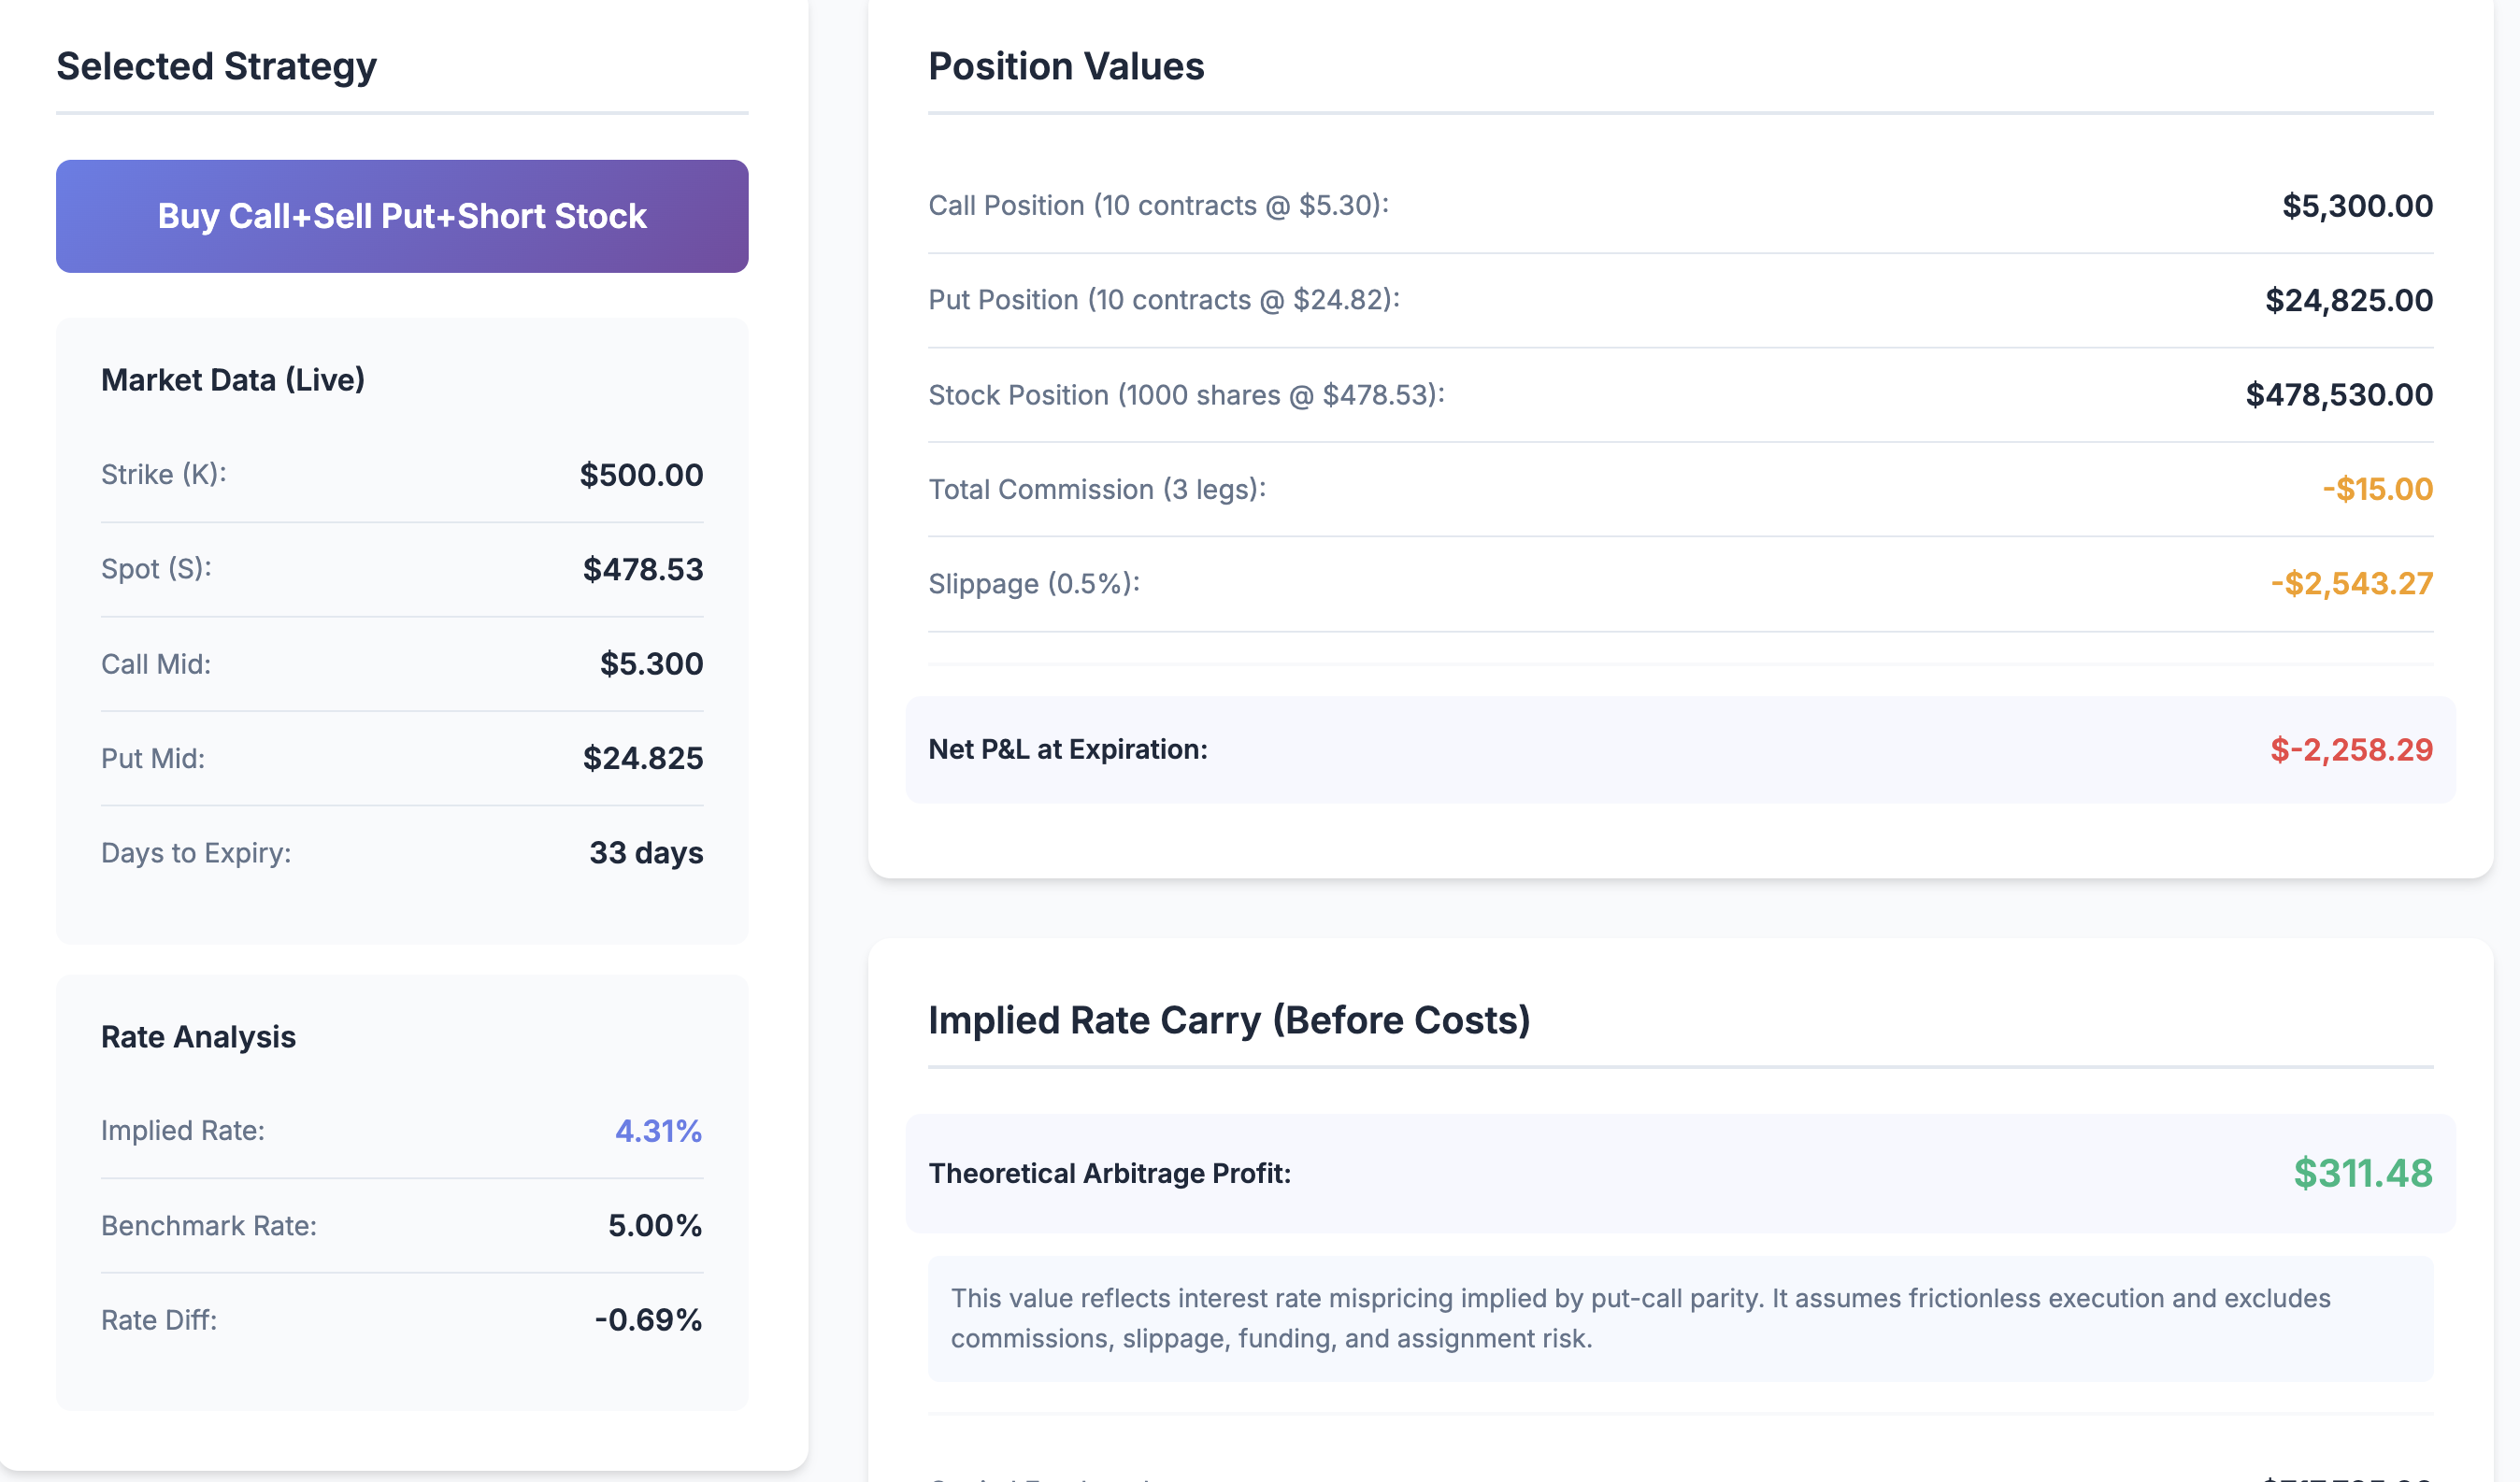
The calculator reports commission, slippage, net P&L, ROI, annualized return, and scenario analysis (best/expected/worst).
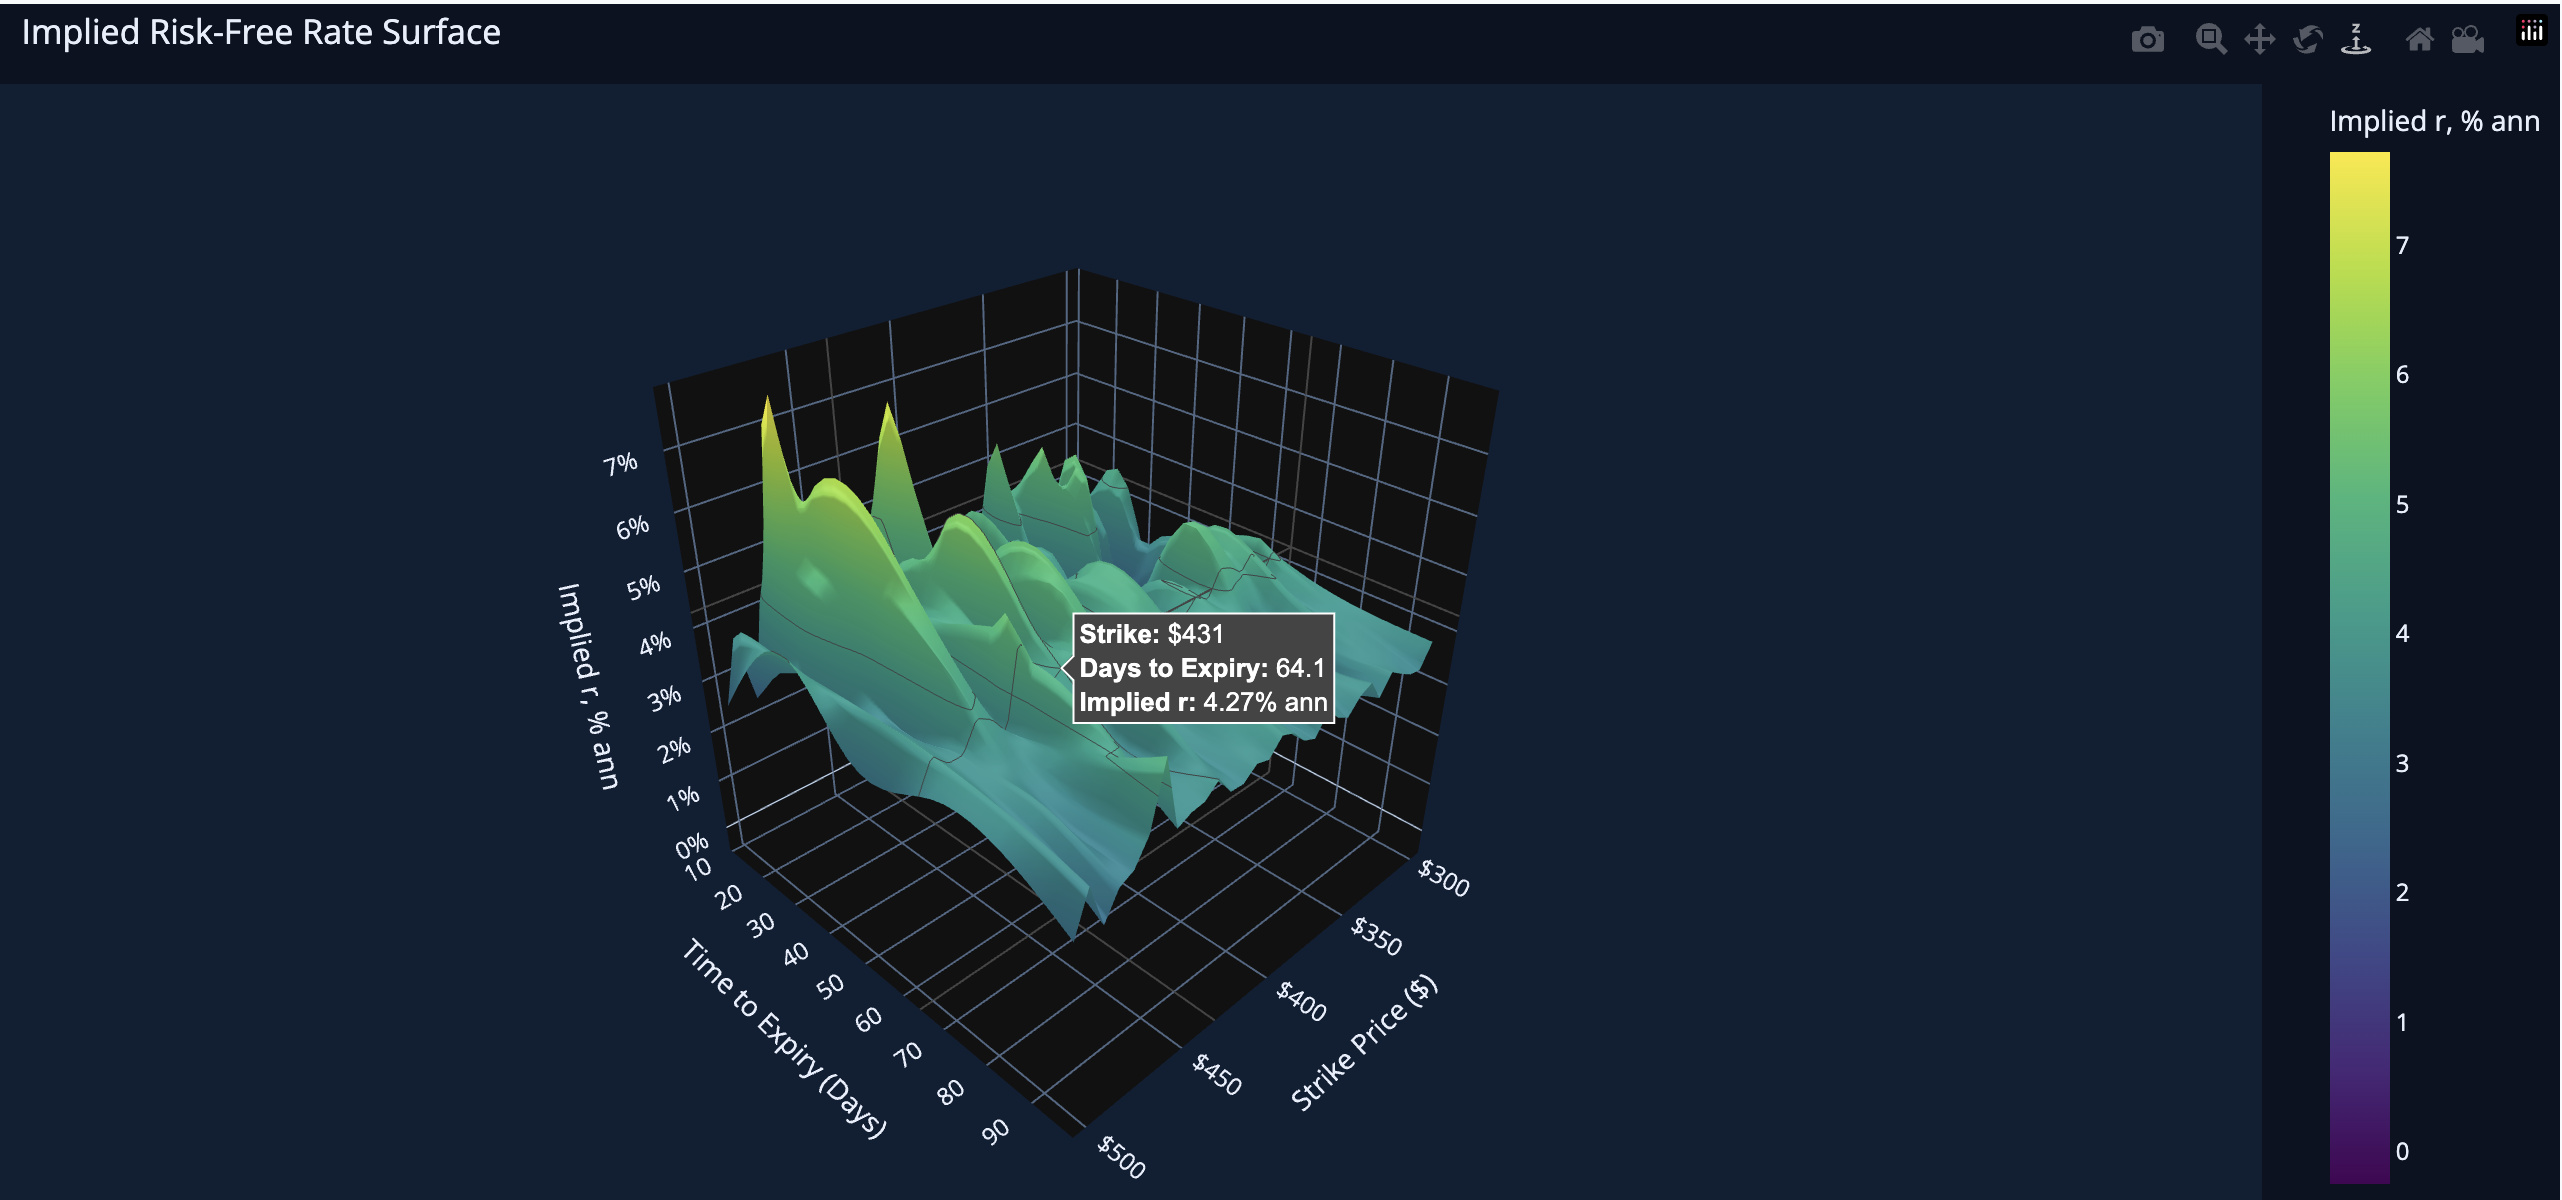
3D Visualization
The 3D Visualization tab plots an implied rate surface across strike and time to expiry, helping users understand how rate mispricing varies across the options chain.